
Forward to third section of report — Back to Tax Revision Commission main page — Back to first sextion of report
|
Columns DCWatch
Archives Elections Government and People Budget issues Organizations |
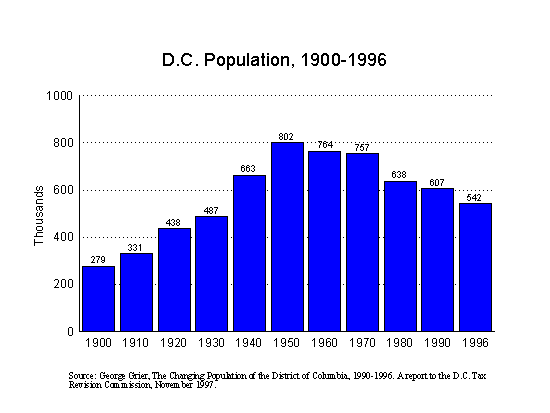
Chapter 1. BackgroundBefore considering specific recommendations, the Commission examined the District's economy, government finances, and tax structure. This chapter reviews its findings in these areas. The chapter begins with a summary of the District's recent economic crisis and its current improved economic outlook. This review of the local economy also includes an analysis of the District's population decline and the Commission's analysis of how taxes relate to the changes in the economy and population. The discussion then moves to the Commission's examination of government finances, including an analysis of the events that led to the financial crisis of the mid-1990s and current financial prospects. The analysis continues with a review of the current District revenue structure and rates and an analysis of the unique and distorting role the federal government has played in their development. This section concludes by making the case for simplifying the tax structure. Back to top of page — Back to Table of Contents The economyEconomic crisisIn the early 1990s, the nation's capital was rocked by a depressed economy, severe population loss, and a government near insolvency. From 1990 to 1996, employment in the District declined from 687,900 to 623,000. From 1989 to 1995, unemployment rose from 5 percent to 9 percent, and commercial real estate values plummeted. In the 1990s, the District's population continued to decline as it had since the 1960s (Figure 1). From 1990 to 1996, the District lost 65,100 residents, or 10.7 percent of its population. Income tax filers decreased by 62,000 from 1989 to 1996. The District incurred an accumulated deficit that exceeded $500 million by 1996. Figure 1
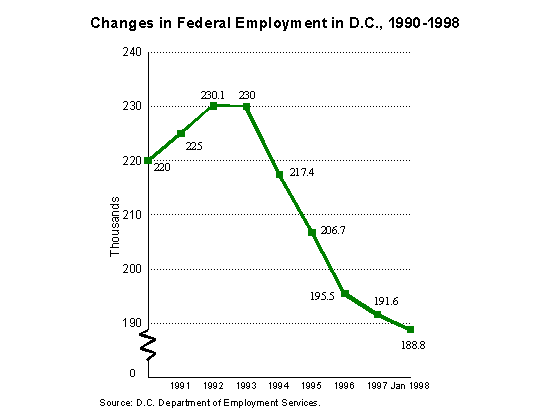
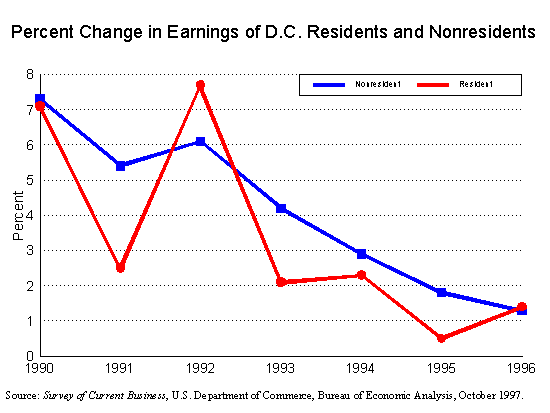
The District also was severely affected by federal agency reductions in payrolls and the District's own reductions in spending. The steep decline in federal government employment that began in 1993 contributed to the District's decline in employment (Figure 2). The rate of both resident and nonresident earnings growth also slowed in the 1990s (Figure 3). Figure 2
Figure 3
Back to top of page — Back to Table of Contents Potential for economic recoveryIn coming years, the District economy should resume a positive growth rate as downsizing in the federal government reaches an end and other new initiatives are put into place. The federal Tax Relief Act of 1997 provides $1.2 billion in tax incentives over the next five years for businesses and residents (Appendix C). President Clinton has proposed $50 million in the 1999 budget to launch a new District economic development corporation. In addition, the Commission's recommendations can lead to a fairer tax system that enhances tax certainty, stability, and economic efficiency and improves the District's ability to compete with neighboring jurisdictions. A solvent District government, the federal tax incentives, a new federally funded economic development corporation, and the tax restructuring proposed in this report all bode well for the image and future of the city. A hopeful sign that improvement has started is a robust 7.0 percent growth in private sector earnings in the second quarter of 1997, as compared with the same quarter in 1996. This increase in the District almost matched Virginia's 7.1 percent growth rate and exceeded both Maryland's 6.8 percent rate and the national 6.1 percent rate. The District's fiscal year 1997 budget surplus, based in part on a healthy 4.1 percent growth in revenues, adds to the hope that improvement is underway. This improvement, however, depends in part on whether the federal government stabilizes its activity in the District; recent figures show that the federal government continues to be a drag on the local economy. For example, the District's overall earning increase for the year ending in the second quarter of 1997 was a low 3.8 percent — despite private sector growth--because of a 0.3 percent drop in government earnings in the District. Also in 1997, federal government's procurement spending in the District declined while federal procurement spending in the suburbs increased (Figure 4). Figure 4
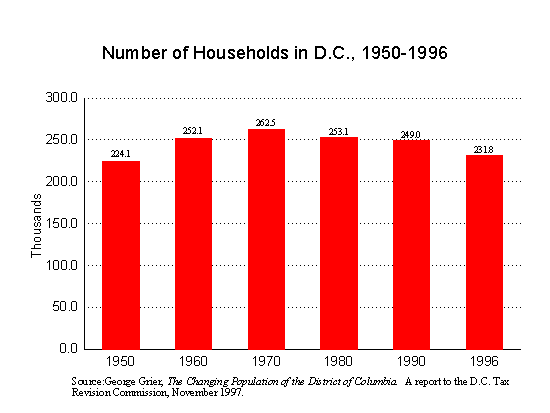
Back to top of page — Back to Table of Contents The District's population loss: A major concern of the 1990sThe Commission focused special attention on population loss because of the resulting lost personal income taxes. As only residents pay personal income taxes, population losses can cause a significant decrease in revenues. Loss of households, moreover, is potentially more damaging than simple loss of population; households represent a taxpaying unit that contributes both property taxes and income taxes. While the District has been losing population since the 1950s, the loss is attributable primarily to smaller family size rather than fewer households; family size decreased from an average 3.19 in 1950 to 2.27 in 1990. The number of households declined slightly in the 1970s and 1980s, but overall from 1950 to 1990, population declined 24 percent and households increased 11 percent. From 1990 to 1996, however, the District lost 17,200 households in addition to losing population (Figure 5). Figure 5
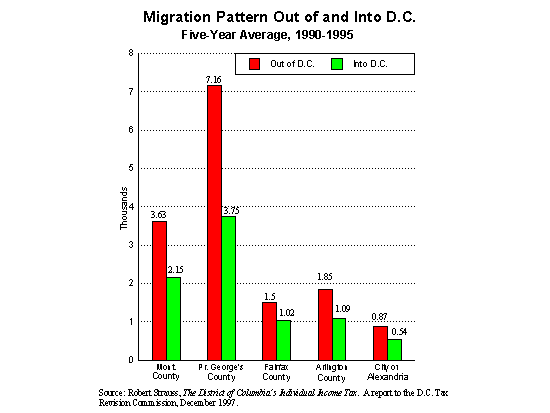
In considering changes in households, it is important to recognize that the loss is a net difference between those moving into the city and those moving out. When the Commission examined migration patterns in the Washington area, it found that most people who left the District went to the Maryland suburbs, but that a large number of people also moved into the District from those same suburbs (Figure 6). Figure 6
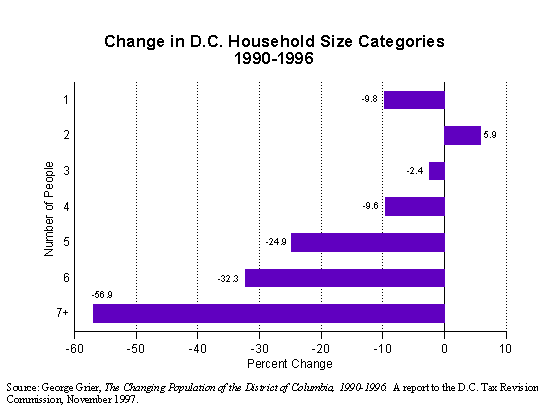
The number of households also changes because of the merging or division of households that remain in the city. For example, between 1990 and 1996, there was almost a 10 percent drop in one-person households, two-person households increased about 6 percent, and all other household sizes declined (Figure 7). It seems likely that a number of the lost one-person households simply became two-person households. The Commission can only speculate about the reasons for these changes. Figure 7
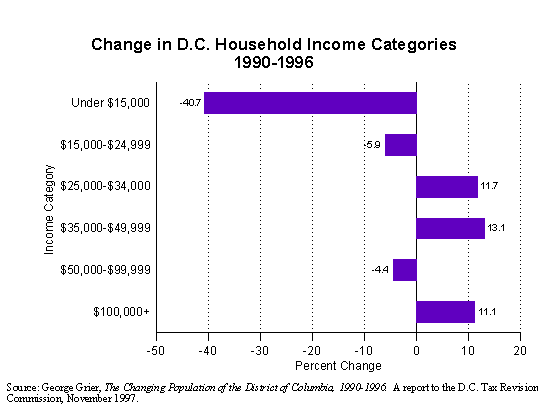
Poor households, whose members are not major taxpayers, account for a large proportion of the District's decline in number of households. Between 1990 and 1996, the District lost 23,800 households with incomes under $15,000, which is more than 40 percent of the households in that bracket in 1990. Middle- and high-income households--those with incomes between $25,000 and $50,000 and those with incomes greater than $100,000--increased over the same period (Figure 8). Figure 8
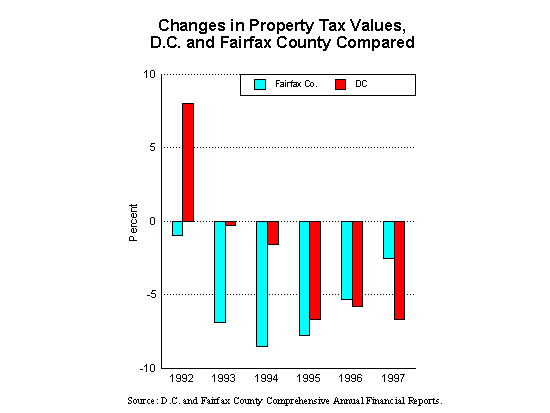
An analysis of who paid personal income tax between 1989 and 1995 shows a similar pattern. During that period, the District lost 37,150 or 35 percent of taxpayers who earned less than $15,000. While many of the low-income households may have left the District, it also is likely that many of them moved into higher classes of household income. The decrease in households from 1990 to 1996 resulted in a net decline of 17,400 children, or a 15 percent reduction to 96,800. The percentage loss of children was only slightly greater than the overall 11 percent drop in population. While many speculate that the District's population loss is attributable to its bad schools, 68 percent of those households that moved to Washington's suburbs had no children. Back to top of page — Back to Table of Contents The role of taxes in the District's economic decline and loss of populationA critical component of the Commission's work was examining changes in the District's economy and identifying the reasons for those changes. Of particular importance is whether taxes caused the deterioration in employment and population and the accompanying poor revenue performance of the 1990s and whether reductions in tax rates would improve the outlook for the future. The Commission explored the effect of taxes on population, employment, retail sales, and property values. Its conclusion: Taxes may have had some adverse effects on individual business decisions, but the evidence in recent years points to nontax reasons for the District's lagging economy. Therefore, while this report identifies some taxes that should be eliminated or reduced to improve the District's economy, the Commission does not believe that such reductions should be made at the expense of vital services needed to keep the District attractive to residents. Specific conclusions for each of the four areas — population, employment, retail sales, and property values — follow. Back to top of page — Back to Table of Contents PopulationThe Commission examined population change across the Washington metropolitan area from 1969 to 1994 using middle-income taxpayers as a representative population. The Commission did not discern any change caused by the income tax rate, the residential property tax rate, or the general sales tax rate. (Other taxes borne by households, such as the gross receipts tax on utility services or the selective sales tax rates were not included in the study.) The principal population decline was in low-income households, which are least affected by income taxes. In addition, the only class of households that grew between 1990 and 1996 — middle-income households — should be the most sensitive to income tax rates. Studies of where households moved provide additional evidence: Income tax filers who left the District for the suburbs between 1989 and 1996 went overwhelmingly to Maryland and not to Virginia, despite the lower income tax rate in Virginia and comparable tax levels in Maryland. The Commission concluded that while the reason for loss of population in the 1990s cannot be clearly identified, there is no evidence that suggests tax policies were to blame. The loss of population, moreover, was not accompanied by a substantial loss in related tax revenues. The District lost $60 million in annual revenue over five years due to population decline, and this loss equals only 2.3 percent of the District's 1996 local revenues. The $60 million results from lost income tax and sales tax revenues. Income tax revenues would have been $39 million higher over the five-year period if every District resident who paid taxes in 1989 stayed in the District through 1995. Sales tax revenues would have been $21 million higher had the number of households not declined. Back to top of page — Back to Table of Contents EmploymentLooking at taxes on businesses, the Commission found statistical evidence that the business personal property tax had a significant negative effect on job growth. The sales tax may have had negative effects on employment growth. The sales tax appears to influence employment growth in the services sector, and the personal property tax affects the retail trade and construction sector. In the service sector, a 1 percentage point decrease in the sales tax, which would reduce District revenues by $50 million, was estimated to increase the service employment growth rate by 4.0 percentage points in the following year. A 1 percentage point decrease in the personal property tax rate (currently 3.4 percent in the District) would increase growth in retail employment by 2.6 percentage points in the following year and decrease District revenues by $18 million. The Commission's analysis did not determine the effects of the higher commercial property tax and corporate income tax rates. Another study, published by the Brookings Institution, found that the difference in the commercial property tax rate between the District and surrounding jurisdictions may have had a negative effect on the District's share of the region's employment. In the study, a $0.10 decrease in the commercial property tax, currently $2.15 per $100 of assessed value, was estimated to lead to 7,000 more jobs in the District within five years. Back to top of page — Back to Table of Contents Retail salesThe Commission is concerned about the decline in the District's retail activity and considered whether the sales tax rate played a role in that decline. There has been a dramatic, consistent decline in the District's share of retail sales in the metropolitan area. The District's share of regional retail employment declined from 34.1 percent in 1969 to 14.4 percent in 1994. From 1982 to 1992, retail sales fell from 16.1 percent to 11.9 percent in 1992. The decline in sales affects all types of retailing, but is less pronounced in eating and drinking establishments, gas stations, and drug stores. Retail employment relative to population is lower in the District than it is in the rest of the region. Key questions are whether the District sales tax rates caused the large declines in sales and retail employment and whether lower tax rates would reverse the pattern. The Commission concluded that the District's loss of population better explains the trend in retail employment than do differentials in sales tax rates, although one study suggests that a 1 percentage point decrease in the rate might produce a 4 percentage point increase in the growth rate of employment in the retail sector in the following year. The analysis does not indicate whether the trend of retail activity moving out of the District to the suburbs can be reversed by lowering tax rates. However, shopping habits are formed over many years, and it is unlikely that more favorable tax rates would have an immediate, noticeable effect on the location of retail activity. Back to top of page — Back to Table of Contents Property valuesThe sharp decline in assessed value of land and buildings in the 1990s appeared to be attributable to national and regional declines in property values and not to District tax policies. For example, in 1995, the District's worst property-tax year of the 1990s, the city's property tax base declined 6.7 percent. Fairfax County experienced an even higher 8.5 percent decline in 1994, its worst year (Figure 9). Figure 9
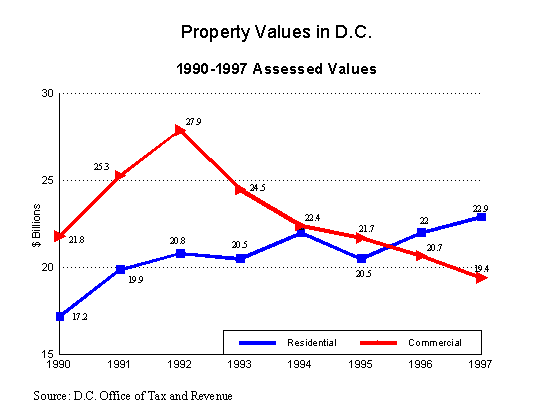
Back to top of page — Back to Table of Contents Government financesEffects of the economy on District financesThe District's declining economy had a dramatic effect on District tax revenues. From 1991 to 1996, revenues from real estate property taxes decreased more than 22 percent, from $802 million to $624 million. Taxable values of commercial real estate, which peaked at $27.9 billion in 1992, dropped 30 percent to $19.4 billion over the next five years. Residential property values remained virtually unchanged from 1991 to 1995, and began an upward movement only in 1996 (Figure 10). Income and sales taxes grew about 12 percent from 1991 to 1996, but this growth was well below inflation and was barely adequate to offset the real estate decline over that period. Figure 10
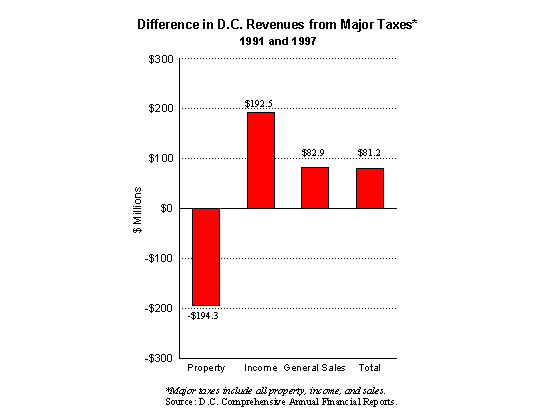
As a consequence, total District revenues from the city's three major taxes (real property, income and sales taxes) increased only $81 million or about 3.6 percent over six years (Figure 11). This increase in revenues was not even sufficient to pay the increased cost of long-term debt service, which rose $110 million during the same period. The District's management was unable to reduce other spending sufficiently to offset the inadequate revenue growth. Figure 11
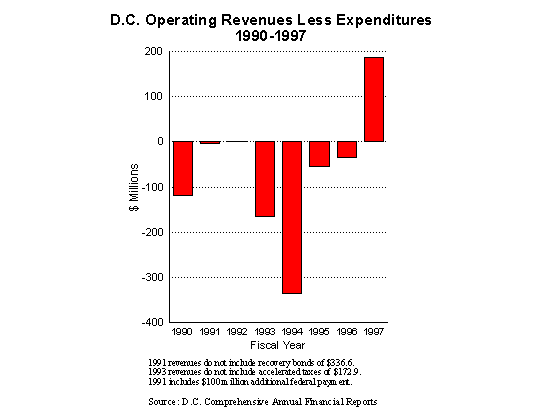
As a consequence, the District's budget was unbalanced in 1992, 1993, 1994, 1995, and 1996. These imbalances led to an accumulated deficit of $518.2 million at the end of fiscal 1996. Back to top of page — Back to Table of Contents Taking control of the financesIn 1995, the President and Congress addressed these severe problems by creating the District of Columbia Financial Responsibility and Management Assistance Authority (control board) to oversee District budgets and ensure that expenditures were kept within revenues. At the same time, the Mayor and District Council created the D.C. Tax Revision Commission to address failing revenues by analyzing existing tax laws and by proposing comprehensive reforms where necessary. Today, the District's finances are beginning to improve, and the changes are due to a combination of factors, including improvements in the private-sector economy, the control board's expenditure policies, and an increase of 4.1 percent in 1997 revenues. In fiscal year 1997, the District's budget was in balance, and revenues exceeded expenditures by $185 million (Figure 12). This surplus reduced the accumulated deficit to $332.3 million. A similar balanced budget and reduction in the accumulated deficit is expected in fiscal year 1998. By the end of 1999, the District's accumulated deficit should be eliminated, and its operating budget should continue to be in balance. Figure 12
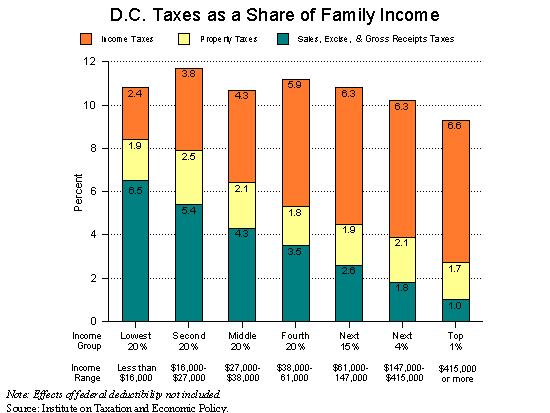
Back to top of page — Back to Table of Contents Tax structure and ratesOverview of the District's revenue structureThe District had 19 identifiable taxes in 1997 that include all the taxes typically used by state and local governments. The general sales tax and the real property tax each have five separate rates that are applied to different bases. If each rate is counted as a separate tax, there are really 27 different taxes. These taxes raised $2.6 billion in fiscal year 1997 (Appendix D). Nontax local general revenues added another $0.3 billion. Overall, the District has a balanced revenue system that incorporates most of the taxes that would be employed by both state and local governments. The most productive tax is the personal income tax, which had revenues of $753.5 million in 1997, followed by the real-property tax with $617.7 million in revenues, and the general sales tax with $514.5 million. The smallest revenue producer is the excise tax on alcoholic beverages with revenues of $5.5 million. The District's tax revenues are reasonably divided between income, sales, and property. A review of the incidence of District taxes found them to be distributed relatively evenly across income classes. As a share of family income, they ranged from 10.8 percent on the lowest 20 percent of incomes to 11.2 percent on the fourth 20 percent of incomes (Figure 13). (The review did not include the effects of federal deductibility of some District taxes.) Although the highest 1 percent of incomes pay only 9.3 percent of family income in District taxes, the tax system overall is more progressive than most state and local tax systems. Figure 13
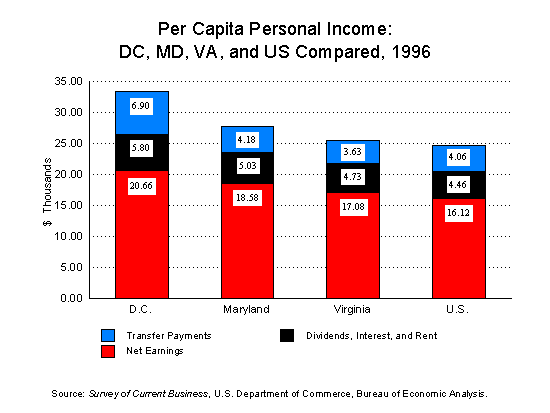
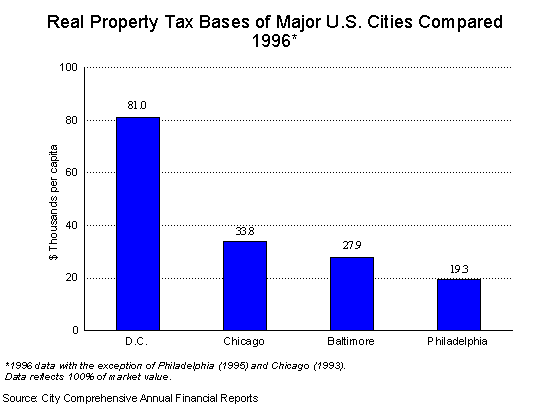
The District's nontax revenues constituted 9.7 percent of local general-fund revenues in 1997, a small increase from 1996. In 1994, the Census Bureau, reporting on a different basis, concluded that when all nontax revenues were combined — including those received by the University of the District of Columbia (UDC), D.C. General Hospital, the sewer and water authority, and other special revenue funds--nontax revenues were 14 percent of total revenue. Using either figure, the District's nontax revenues compare poorly with the combined state and local government nontax revenues in Maryland (19 percent), Virginia (27 percent) and the United States as a whole (24 percent). The lower reliance can be attributed to three factors: (1) The District does not receive revenues from existing charges for toll roads, airports, water ports, and natural resources, or from revenues from the sale of natural gas or utility; (2) District fees for higher education, hospitals, and solid waste management are relatively low; and (3) The District has a relatively high concentration of low-income families compared with state and local governments in the aggregate. Back to top of page — Back to Table of Contents Comparing the District with neighboring jurisdictionsThroughout its work, the Commission compared the District's tax structure and tax rates with those of other cities nationally and with surrounding jurisdictions. These comparisons provide a necessary starting point, but are not always fair, given the District's unique structure. While the evidence that taxes are retarding the District's economy may be lacking, the Commission believes that the city's long-term economic health requires that its tax system be competitive with those in neighboring jurisdictions. A comparison of rates clearly shows that some are not in line. The most prominent are the commercial and hotel property tax rates. At $2.15 and $1.85 per $100 of assessed value, respectively, these rates are close to double the uniform property tax rates of Arlington County ($.96), Prince George's County ($1.05), and Montgomery County ($1.07). The District's corporate income tax rate provides another example. Only three states have rates higher than the District's 9.975 percent, which also is well above the 7 percent Maryland and 6 percent Virginia rates. Comparisons of sales and personal income tax rates to those in neighboring jurisdictions are more complex because the jurisdictions structure these taxes differently and include different items in the bases. For example, the District's basic sales tax rate is 5.75 percent, but it has four additional higher rates — reaching 13 percent — that apply to parking, restaurant meals, hotels, and liquor. If these separate tax rates were combined to form a single general rate, that rate would be 7.6 percent. In comparison, Maryland's general rate is 5 percent, and Virginia's is 4.5 percent. These states do not have the separate higher rates for some purchases. Virginia's broader tax base, which includes food purchased for home consumption, somewhat offsets its lower rate. The highest personal income tax rate in the District is 9.5 percent on taxable incomes in excess of $20,000. The highest rate in Maryland is 8 percent, and the highest in Virginia is 5.75 percent. In Maryland, however, the 8 percent applies to taxable income starting at $3,000, while the District's 9.5 percent rate does not apply until taxable income exceeds $20,000. Thus in Maryland, taxpayers pay $104 more on their first $20,000 of income than they do in the District. In terms of burden, the District's income tax revenue is equivalent to 3.8 percent of total personal income compared to Maryland's 4.1 percent and Virginia's 2.7 percent. Taxes on District residents generally are comparable to Maryland for middle income residents, but are substantially higher than Virginia for all income levels. Back to top of page — Back to Table of Contents Effects of the unique federal relationshipThe District has a unique relationship with the federal government that influences the District's tax structure in ways not found in other state and local tax systems. The District is at the same time a major city, similar to other cities, and a constitutionally mandated capital under the jurisdiction of the U.S. Congress. This unique position provides both benefits and disadvantages. Among the benefits are the prosperity that comes from masses of tourists that flock to the city's attractions. The District also is a magnet for firms and organizations that do business with the federal government. Finally, the federal government provides benefits to the residents of the District through services and amenities that otherwise would be provided by the local or state government, including a national zoo and arboretum, and federally maintained museums, parks, recreation facilities, and streets. As a consequence of the federal presence, the District is a prosperous jurisdiction with per capita income greater than that of Virginia, Maryland, and the United States as a whole (Figure 14). The District also has a real property tax base that far exceeds that of other major cities, despite the declines of recent years (Figure 15). Figure 14
Figure 15
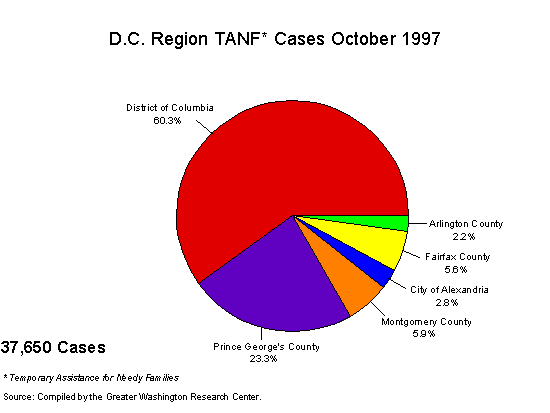
Offsetting this prosperity, the District has service demands and problems characteristic of other central cities. For example, the District supports more than 60 percent of Temporary Assistance for Needy Families (TANF) cases in the immediate metropolitan area (Figure 16). Unlike other cities, however, the District has no state to provide financial assistance in meeting these demands. Figure 16
Back to top of page — Back to Table of Contents Unique restrictions distort the tax systemThe District faces federal restrictions on its income tax base that apply to no other city or state. About two-thirds of District jobs are held by nonresidents, but the District cannot tax the income they earn within its borders. In addition, federal and foreign governments are a significant presence in the District, but their properties and purchases of goods, services, and equipment cannot be taxed. As a result of these unusual restrictions, the District's tax system is distorted in two ways. First, inability to tax broad revenue bases that would otherwise be available has resulted in high tax rates on the narrow bases that can be taxed. Second, in an effort to overcome the restrictions and access the forbidden tax bases, the District has instituted taxes that are in some ways flawed. A good tax system pays for government services by taxing broad bases at low rates. This approach ensures that all who use the services help finance them, and it allows for sufficiently low rates that do not result in economic disincentives. The District's tax system, in contrast, must rely on narrow bases that require high rates on private-sector commercial activities and District residents. As the Commission examined District taxes, it found repeated instances of tax policy directly related to federal restrictions. For example, the commercial property tax rate in the District--generally double the comparable rates in the suburbs — puts the District at a severe disadvantage. If federally and foreign-owned properties that are similar to commercial properties were taxable, the commercial property tax rate could be approximately halved to a rate almost identical to the suburban rates. Utility taxes also are distorted. The federal government does not pay sales tax, but it does pay a gross receipts tax contained in utility charges. The District, therefore, imposes a high 10 percent gross receipts tax on utility purchases. The inability of the District to tax nonresident income--and thereby take advantage of its large earnings base — has been noted and protested for many years. Indeed, the District alone is subject to this federal restriction. In its efforts to overcome the inability to tax income, the District has both corporate and personal income tax rates that are substantially higher than adjoining jurisdictions. It also enacted a unique tax on unincorporated businesses in order to tax professional firms and other businesses that were not subject to the corporate profits tax. Unfortunately, the D.C. Court of Appeals ruled much of the unincorporated tax illegal, and the District now imposes the tax on only some firms. These damaging tax features combined with other aggravating taxes that result from federal restrictions have given the District a bad tax reputation. As a consequence of the distortions caused by the federal role, the Commission is unable to recommend all the desirable changes that would remove tax inequities and provide positive incentives for businesses and residents to locate in the District. The Commission is concerned about this limitation on its recommendations. Therefore, in a separate section, it makes recommendations to the federal government that include changing its restrictions on District taxing powers. Without the recommended federal actions, some of the worst features of the District tax system cannot be corrected. The Commission believes, however, that the District can make major changes that will improve the existing tax system, even without federal assistance. Back to top of page — Back to Table of Contents The case for simplicity in the tax systemThe District's current tax system has features that are difficult to understand and are cumbersome, bordering on ludicrous, for both taxpayers and tax administrators. The Commission set a goal of abolishing these features. Under the Commission's proposal, three of the administratively worst taxes — the personal property tax, unincorporated business tax, and Class 5 property tax on vacant properties — are eliminated. Four confusing property tax relief measures are consolidated into one simple relief mechanism. The personal income tax is streamlined to a simple one-page form for all residents, and low-income residents no longer will have to file tax returns. Residential properties will no longer have to be divided into rental or owner-occupied classes. Back to top of page — Back to Table of Contents Discarding taxing languageThe language from some of the tax forms that would be eliminated demonstrates why these simplifications are overdue. For example, those who do business in the District must decipher the following language to determine which business tax they must pay:
Determining which tax to pay is just the beginning for businesses. The District imposes an extensive set of record-keeping requirements that businesses must maintain solely to determine the tax base subject to the personal property tax. The tax applies to items the business taxpayer owns, leases, or rents. The records must track property in four different classes: (1) books, cassettes, and other reference materials; (2) furniture, fixtures, machinery, and equipment; (3) unregistered equipment, which includes equipment mounted on vehicles but not the vehicles themselves; and (4) supplies. In addition, all property must be classified into six categories, each of which has a different depreciation rate. Coffee makers, which can be depreciated at 20 percent per year, must be distinguished from kitchen equipment, which is to be depreciated at 10 percent a year. Likewise, linens in reserve, which cannot be depreciated, must be distinguished from those in service, which are to be depreciated at 50 percent a year. Finally, no item may be depreciated more than 75 percent of its original purchase price. Residents also are subject to virtually incomprehensible language and long, confusing forms (Appendix E). The current D.C. Tax Facts, published by the District government, describes the residential property tax relief measures as follows:
These relief measures are further complicated by a provision that the homeowner's exemption is available only to those who apply for it and have paid the District's personal income tax. When the District recently sought to enforce this measure, many taxpayers failed to understand the requirements and were distressed by notices declaring their lack of compliance. Regardless of the District's economy and finances, the Commission believes that removing these complications and streamlining the tax system is necessary. Back to top of page — Back to Table of Contents — Forward to next section |
![]()
Send mail with questions or comments to webmaster@dcwatch.com
Web site copyright ©DCWatch (ISSN 1546-4296)
![Percent change in federal spending]](slide4.gif)