|
IV.1. Service
The exhibit below examines the trend in the combined level of WMATA, Montgomery County,
and Fairfax County, and the City of Alexandria bus services in the region.5
The trend in the regional total shows that total WMATA plus local bus service reached a
peak in 1992 after a gradual increase from 1984. Since 1992, total regional bus service
has declined; although local bus service levels have grown, WMATA bus service has been
greatly reduced. This was primarily due to financial pressures on local governments,
particularly in Fairfax County and the District of Columbia. Consequently, in 1977, when
only Montgomery County was operating a separate bus service, WMATA provided 99 percent of
the region's bus service miles; but by 1996, WMATA operated only 74 percent of the
region's service.6
Bus Service Levels: 1977-98
(Millions of Bus Miles per Year)
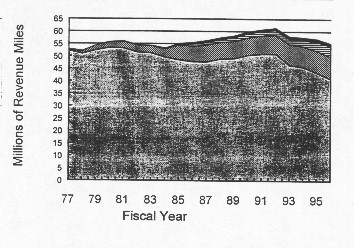
Dash (thin black line on top)
Connector (second striped layer)
Ride-On (third cross-hatched layer)
Metrobus (bottom gray layer)today's level of service same as '81 despite more than 40% regional growth
Metrobus operated 99% of service in '77, 74% today
Although all WMATA bus service is provided directly by WMATA through its own employees,
it should be noted that not all of the service provided by the local jurisdictions is
provided in this manner. For example, the City of Fairfax (CUE) provides all of its
service directly with its own employees, as WMATA does, while Fairfax County provides all
of its service ("Connector") through competitively procured contracts, but holds
title to the vehicles. Montgomery and Prince George's County provide service
("Ride-On" and "the Bus", respectively) on some routes with their own
employees and vehicles, and on other routes through a contract with a private
owner/operator. Throughout its discussions, the Panel seldom distinguished between
directly operated and privately contracted service; rather, the Panel addressed the
distinction between service planned and provided through a regional entity such as WMATA
and service planned and provided through a local jurisdiction.
As discussed above, total bus service levels have remained relatively constant
since 1977. The charts on the following pages [not included on-line] show how the size of
the region, in terms of population and employment, has expanded. This growth in population
and employment is expected to continue over the next twenty years as the two maps on the
following pages [not included on-line] illustrate. While the number of jobs located
outside the central business district will increase by a higher percentage than in the
central business district, the total number and concentration of jobs will continue to
remain higher in the traditional central business district core area of the region.
The graph following the maps presents total daily person trips to employment in (1)
central jurisdictions (Washington, D.C., Arlington County and the City of Alexandria), (2)
inner suburbs (Montgomery County, Prince George's County, Fairfax County, City of Fairfax
and City of Falls Church) and (3) outer suburbs (Loudoun, Prince William, Calvert,
Charles, Frederick and Stafford Counties). Work trips to the central jurisdictions are
expected to grow by 137 percent between 1990 and 2020. Work trips to the inner suburbs are
expected to grow by 178 percent, while the highest rate of growth (206 percent) is
expected in the outer suburbs. However, the central jurisdictions, WMATA's core service
area, will still exceed the outer suburbs in total work trips. To maintain the
economic viability of the region, the Panel emphasized the need for a cost-effective means
of providing bus transportation that could serve, not only the central jurisdictions, but
also be flexible and responsive to meet the changing marketplace of the inner and outer
suburbs.
Back to Regional Mobility Panel Report
Table of Contents
IV.2. Cost
The following graph illustrates the relative unit costs of the major bus operators in
the region. The local jurisdictions operate service at lower cost rates than WMATA, and
there is no significant trend in the difference between the cost levels.
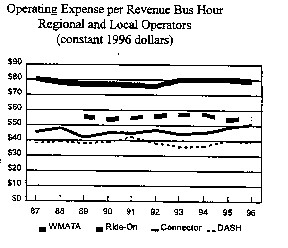
- Metrobus costs are higher reflecting a typical metropolitan operator labor contract
- all operators have controlled costs over time
- most metropolitan operators with suburban counterparts have similar cost relationships
The Panel discussed data showing that WMATA's operating costs were similar to major
metropolitan peers, and that a similar differential distinguished metropolitan system from
suburban system cost levels in other metropolitan areas.7
The Panel reviewed data that focused on the following factors as contributing to the
difference in cost levels between WMATA and the local jurisdictions:
- Wage rates
- Fringe benefits
- Work rules
- Service profile
- Wage progression
The Panel reviewed data illustrating the contrast in wages between Metrobus and local
jurisdiction operations. As shown in the following table, even though starting wage rates
are similar, the Metrobus wage progression and high tenure result in a higher average wage
than is paid to local service operators.
| Bus Operator Wage Rates
and Tenure |
| System |
Average $/Hour |
Starting $/Hour |
Average Tenure |
| WMATA |
$18.35 |
$11.34 |
15.6 yrs. |
| Ride-On (In-house) |
$14.98 |
$11.38 |
6.6 yrs |
| Dash |
$12.93 |
$10.64 |
4.5 yrs |
| Connector (Newington) |
$11.51 |
$10.13 |
|
| Connector (Herndon) |
$9.77 |
$9.20 |
|
Source: WMATA survey, October 1996
- WMATA labor contract based on national employment trends
- Operator seniority results in higher average wages in older systems
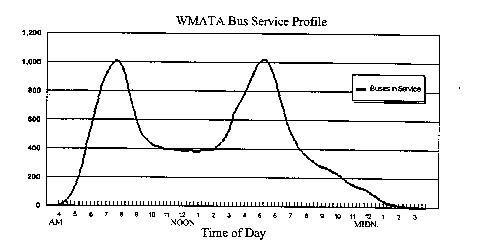
The WMATA labor contract work restrictions and pay provisions are particularly costly
for service that requires large numbers of operators for short lengths of time in the
morning and evening rush hours, and relatively fewer operators in the midday and evenings.
The Panel devoted considerable attention to the daily service profile, specifically, the
ratio of the number of buses required for peak rush hour service to the number of buses
required in the midday base (the peak-to-base-ratio). Because of the commuter
oriented nature of the Washington region's travel market and changing travel patterns, the
Washington region has an unusually high peak-to-base ratio (2.85:1) compared to a 2.0:1,
which is typical for the transit industry. This reduces the productivity of the fleet and
of operator labor.
The high service profile is caused by:
- commuter based market
- highest female work force participation in U.S.
- highest rate of 2-income households in U.S.
Finally, the Panel noted the effect of Metrobus service reductions. The Metrobus work
force is paid based on the length of time employed, and any reduction in work force
(through attrition or through lay-off policies) separates only the newest, lowest paid
employees. Contraction in service or reduction in force have the effect of increasing the
average hourly cost of labor, the largest component of Metrobus costs. Conversely,
stabilizing or growing the Metrobus system could result in a reduced unit labor cost .
Back to Regional Mobility Panel Report
Table of Contents
IV.3. Allocation of Metrobus Costs
Financial responsibilities for Metrobus are shared by the member jurisdictions. The
funding required from each jurisdiction is computed as the difference between revenues and
costs allocated to the jurisdiction. The method used to allocate subsidy requirements to
the respective jurisdictions has not changed in 20 years, although service characteristics
have changed substantially. The operating deficit allocated to the jurisdictions in FY1997
was approximately $180 million.
The Panel reached the following findings concerning the current formula:
- Outdated Information: The current formula relies on outdated information, such as
the distribution of 1975 peak period buses to allocate certain costs
- Business Planning: The current formula reduces management's ability to implement
system cost saving or fare simplification actions because these actions may result in cost
increases or revenue reductions in some jurisdictions
- Artificial Financial Incentives/Disincentives: Under the current formula,
jurisdictions that reduce bus service save more than the resulting system cost
savings and jurisdictions that increase bus service pay more than the resulting
system cost increases
- Cost Shifting: As bus service is reduced in any one jurisdiction, the unit costs
for all remaining bus service increases resulting in cost increases in jurisdictions that
do not change their service
- Revenue Allocation: The current practice of separately allocating revenues to
Metrobus routes has had the affect of slanting Metrobus fare policies to suit revenue
objectives of each local jurisdiction, resulting in complex and inconsistent fare
structures
One of the themes of the stakeholder interviews was that the allocation problems needed
to be remedied. The fragmentation of the bus system was often attributed in part to the
allocation process, as it was seen as having an accelerating effect on the interest in
substituting locally operated service for Metrobus. The consensus to change the formula
emerged early in the Panel's discussions.
Back to Regional Mobility Panel Report
Table of Contents
IV.4. Service
Integration and Coordination
The Panel also recognized a need to address service coordination from a regional
perspective. In addition to the need for service across jurisdictional boundaries, the
Panel was concerned about the general increase in sideways movements, or circumferential
travel patterns, in contrast to the traditional radial patterns oriented to the central
business district. Recognizing that the Metrorail system serves primarily the traditional
radial travel patterns, the Panel was concerned about the capacity of the regional bus
system to provide transit service for these emerging markets. The Panel shared the
concerns of riders about the user-friendliness and quality of the bus services offered in
the region as a whole, including ease of customer access to information and clarity of the
multi-operator fare structure. In addition, a cohesive marketing strategy is needed to
increase the public's awareness of the region's public transit services.
Many of the public forum speakers noted that fare simplification and the availability
of information was important to them. The stakeholder interviews also established the
general support for fare integration and coordinated marketing of bus service. The Panel
reached consensus that fare simplification and coordinated customer information need to be
included in the bus service improvement programs.
Back to Regional Mobility Panel Report
Table of Contents
IV.5. Funding
The subsidy for the region's transit services is funded primarily from local and state
government general funds or funds dedicated to transportation purposes; Federal operating
subsidies have been and are projected to continue to decline.
Dedicated Funding for Major Metropolitan Systems
The Panel reviewed data about how the largest metropolitan areas fund their transit
operating programs. The Washington area stood out because of the lack of ongoing funding
dedicated to transit. Other areas rely on a variety of dedicated funding sources, of which
a retail sales tax is the most common.
Dedicated Funding for Major Metropolitan Systems
|
Sales Tax |
Gasoline Tax |
Income Tax |
Property Tax |
Tolls |
Other Taxes |
Other Ded. Funds |
Total
Ded.
Funds |
| Dallas |
99% |
|
|
|
|
|
|
99% |
| San Jose |
97% |
|
|
|
|
|
|
97% |
| S.F. Bart |
84% |
|
|
11% |
|
|
|
95% |
| Denver |
94% |
|
|
|
|
|
|
94% |
| Portland |
|
|
|
|
|
91% |
|
91% |
| Seattle |
49% |
|
|
42% |
|
|
|
91% |
| Atlanta |
90% |
|
|
|
|
|
|
90% |
| Cleveland |
89% |
1% |
|
|
|
|
|
89% |
| Orange County |
84% |
|
|
5% |
|
|
|
89% |
| Los Angeles |
81% |
4% |
|
|
|
4% |
|
89% |
| Houston |
84% |
|
|
|
|
|
|
84% |
| Chicago Comm RR |
75% |
|
|
|
|
|
|
75% |
| Minn.-St. Paul |
|
0% |
|
70% |
|
|
|
70% |
| Oakland |
31% |
|
|
31% |
|
|
|
62% |
| NY City Transit |
11% |
15% |
15% |
|
7% |
13% |
1% |
61% |
| NY LIRR |
|
|
|
|
22% |
36% |
|
59% |
| Chicago |
54% |
|
|
|
|
|
|
54% |
| NY Metro-North |
|
|
|
|
9% |
34% |
|
43% |
| S.F. Muni |
|
|
23% |
|
1% |
|
3% |
27% |
| New Jersey |
|
|
|
|
|
|
25% |
25% |
| Philadelphia |
|
|
|
|
|
23% |
|
23% |
| Pittsburgh |
|
|
|
|
|
|
18% |
18% |
| Washington |
|
4% |
|
|
|
|
|
4% |
- most major metropolitan areas have dedicated funds for transit
- most prevalent is the retail sales tax
- the national capital region has minimal dedicated funding
The current situation is the Washington metropolitan area leaves transit in annual
competitions for funding in some of the local jurisdictions. In some instances, transit
competes against other state and local responsibilities for shrinking general fund
dollars. WMATA cannot establish budget priorities or anticipate the results of each
jurisdiction's budget decisions.
For this reason, the Regional Mobility Investment Conference identified, in its
resolution, the need to develop a strategy for a stable, reliable, predictable and
adequate funding for transit services. To take the next steps forward. the Chairman
of the Regional Mobility Panel appointed a funding subcommittee to evaluate overall
regional transit funding needs, to formulate strategies for meeting the needs, and to
report back to the Regional Mobility Panel.
Back to Regional Mobility Panel Report
Table of Contents
IV.6. Critical issues
After reviewing the service, cost, cost allocation, service integration, and funding
background of today's bus services in the Washington region, the Panel identified the
following critical issues:
- the share of bus service in the Washington area provided by the regional bus transit
system (Metrobus) has declined from 99% in 1977 to 74% in 1996 as a result of several
local jurisdictions initiating locally based and operated bus systems, and as a result of
Metrobus service reductions, which have been necessitated by both the opening of the
Metrorail system and budgetary constraints of some local jurisdictions.
- in the absence of a comprehensive regional transit service plan, it is likely that the
shift away from regionally operated bus service will continue to accelerate and will
result in further service fragmentation.
- the amount of bus service provided in the Washington area (both regional and local) has
not grown to keep pace with population and employment growth that has taken place over the
last 25 years
- the cost of operating the Metrobus system (exclusive of capital cost considerations) is
mid- range when compared to other large metropolitan systems but is higher than the cost
of operating locally provided bus services. This is due to negotiated labor provisions
which are tied to national trends, the characteristics of metropolitan bus services
designed primarily to meet commute oriented travel patterns, and the decline in Metrobus
service levels that has limited WMATA's ability to hire new employees at negotiated,
competitive entry level wages.
- the methodology for allocating Metrobus subsidies to local jurisdictions is based on
outdated and inequitable criteria that provide incentives for substituting Metrobus
services and disincentives for remaining in a regional bus system, prevents management
from engaging in sound business planning, and has led to a situation where transit policy
for regional bus services, including fares and service levels, are set by individual
jurisdictions rather than regionally.
- the lack of integration among bus systems in the Washington area, the absence of a
regional approach to bus service planning and policy, and the declining level of bus
service in the Washington region are not compatible with the continued expansion of the
Washington region and the changing employment and population growth patterns that have
occurred and will occur again over the next 20 years. Bus services offer the potential to
flexibly meet the needs of a changing marketplace while playing an important role
in providing feeder services to the extensive Metrorail system and the markets it serves.
- reliance on the separate state and local budget appropriations processes of WMATA's
funding partners from year-to-year, in an era of declining Federal assistance, is reducing
the efficiency and effectiveness of the regional transit system; the region must develop a
long term strategy for providing adequate, predictable and reliable funding for transit.
Back to Regional Mobility Panel Report
Table of Contents
V. Recommendations
Based on its review of the background information and discussion and analysis of the
critical issues, broad consensus emerged from the Regional Mobility Panel on the following
points:
- there is a fundamental need to maintain a regional bus system, most essentially for
interjurisdictional travel, but also for intra-jurisdictional bus service
- criteria need to be established to clearly delineate regional and non-regional services
based on travel markets
- the method of allocating regional bus subsidies needs to be based on the benefits
received and needs to be more equitable
- a regional transit service plan and planning function needs to be established to respond
to the region's changing travel patterns
- the regional transit service plan will not result in the layoff of WMATA unionized
operating personnel
- adequate, predictable, and reliable funding is needed for the regional transit system
Building upon this consensus, the Regional Mobility Panel makes the following
recommendations to the signatories and member jurisdictions of the WMATA Compact and to
the WMATA Board of Directors:
Regional Bus System
- The Regional Mobility Panel has defined an integrated regional bus system that is to be
planned, funded and operated in a manner similar to the approach that has long existed for
the successful Metrorail system. Under the current system. services operated by Metrobus
are only nominally regional, as policy decisions on fares and services are largely
determined by local jurisdictions.
Under the integrated regional bus system proposed by the Panel, for the first time there
will be an ongoing commitment by local jurisdictions to a set of truly regional bus
services planned and operated by WMATA in consultation with local jurisdictions. These bus
services will be coordinated and integrated with a set of non-regional bus services
planned and provided through decisions by local jurisdictions.
Regional Service Plan
- In the defined bus system, regional and non-regional bus routes are distinguished to
serve properly markets in the Washington metropolitan area The new regional service
plan ensures predictability and stability of the existing bus services and fosters the
development of new bus services. This includes criteria that will generally define
regional routes and non-regional routes for both the present and the future, while
acknowledging the services already provided by local jurisdictions.
New Regional Bus Subsidy Allocation Formula
- A new benefit-based subsidy allocation formula for regional bus routes should be adopted
to address inequities and inefficiencies in the existing formula. The revised formula
should be keyed to the existing and regionally accepted formula for the Metrorail system,
and should be updated periodically to remain current and equitable.
WMATA Service and Financial Commitment
- A commitment is being made to a pledge of constant average regional bus fares and
maintaining bus subsidy levels through aggressive cost controls, and a pledge for
advancing service improvement strategies under the Service and Productivity Enhancement
Program for the five year period FY 1998-2002.
Five-Year Transition Plan
- A five-year transition period to the regional and non-regional bus system structure
should be adopted, and based on a staged implementation, assuming no layoffs of WMATA
unionized operating employees. The transition plan should include strategies to improve
bus service through coordinated service planning, the establishment of service standards
quality, defined jointly by WMATA and loca jurisdictions; fare simplification and
integration; comprehensive marketing and customer information services; and market- driven
service planning.
Regional Financial Agreement
- Local jurisdictions and WMATA should enter into an interjurisdictional financial
agreement to participate in the regional bus system in accordance with the regional
service plan, new subsidy allocation formula and five-year transition plan. The Regional
Mobility Panel will identify the funding requirements for the WMATA bus and rail Capital
Improvement Program, and acknowledges its responsibility to address and resolve the issue.
Long-term Funding Strategy
- The Regional Mobility Panel agrees that there is a need to define the magnitude of the
funding requirements for the WMATA bus and rail Capital Improvement Program, and
acknowledges its responsibility to address and resolve the issue. It agrees to reconvene
upon receipt of the recommendations of the Transit Funding Subcommittee, and to meet and
confer during a six-month period resulting in a final course of action designed to ensure
a reliable, predictable and adequate amount of funding for this purpose. The region
together will pursue, support and implement necessary actions in the District of Columbia,
Maryland, Virginia, and the U.S. Congress during the five-year transition period to
fully fund the annual needs of the CIP, as determined by the Panel
Back to Regional Mobility Panel Report
Table of Contents
V.1. Regional Service Plan
Based on principles established by the Regional Mobility Panel, criteria were developed
that recognize the distinction between regional and non-regional bus routes and various
service markets. Regional bus routes generally provide transportation between
jurisdictions. Regional bus routes also may include bus routes that serve major activity
centers, that operate on major arterial streets and carry high volumes of ridership within
one or in multiple jurisdictions.
Existing Metrobus service was evaluated to determine which bus routes meet these
criteria; bus routes currently operated by local jurisdictions were 'grandfathered' into
the non-regional category. WMATA will have responsibility for operating regional bus
routes. Local jurisdictions will have responsibility for determining how non-regional bus
routes will be provided. WMATA intends to work aggressively with the local jurisdictions
to provide service on non-regional bus routes.
The following are the specific criteria used by the Regional Mobility Panel to
disaggregate current Metrobus routes into regional and non-regional categories. The
criteria will also be used for determining appropriate future bus route assignments for
the region, and may result in a different distribution of service between regional and
non-regional categories.
Interjurisdictional - A route is automatically a regional route if it:
- crosses a jurisdictional (independent city, county, state) boundary; and
- penetrates at least two jurisdictions by more than one-half mile in each; and
- operates open door (allows boarding and alighting) over at least a portion of the line
in two or more jurisdictions.
If a route does not qualify as regional under the interjurisdictional definition, then
it must meet at least two of the following three criteria to be regional:
Arterial streets
- operates for a considerable distance on an arterial street and a substantial portion
(usually a majority) of riders use stops on the arterial street. Routes which operate for
a short distance on an arterial incidental to their service areas are not included.
Regional activity center
- serves one or more regional activity centers. A conservative definition of regional
activity centers was used, including only those where there is virtually universal agreement
as to their regional character.8 (Routes which feed Metrorail
stations but which do not directly serve any regional activity center were not considered
to be regional).
Cost effectiveness
- annual boardings per annual platform hour greater than 30 applied consistently in all
jurisdictions.
The application of the criteria to the bus service currently operated by WMATA results
in the following:
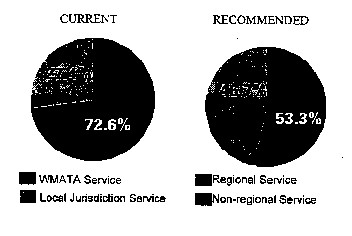
- For WMATA operated bus service:
- 73.6% of WMATA bus service is designated as regional bus service to be planned and
operated by WMATA as a regional system.
- 26.4% of WMATA bus service is designated as non-regional service to be operated as it is
today - local jurisdictions plan the service and can choose the operator (either Metrobus,
local jurisdiction operation or contract services)
- For all bus service in the region:
- 53.3% is designated regional service
- 46.7% is designated non-regional service
Back to Regional Mobility Panel Report
Table of Contents
V.2. New Regional
Bus Subsidy Allocation Formula
The regional system should be funded using a regional, benefit based allocation of
subsidy. The Regional Mobility Panel had the following goals for a new bus subsidy
allocation formula:
- Develop an easy to understand formula Rely on information that can be periodically
updated
- Develop a formula that allows WMATA to make rational business decisions
- Develop a formula that reduces incentives to eliminate service and increases incentives
for ridership growth
- Develop a formula that is similar to the regionally accepted Metrorail allocation
process
Accordingly, the Panel considered several formulas that would:
- Allocate Metrobus subsidy regionally
- Use data that could be periodically updated
- Allocate subsidy based on benefits received in each jurisdiction
The Panel recommends that the required subsidy for regional bus service be allocated
according to the following factors:
- population and population density in each jurisdiction (25%),
- average weekday bus riders by jurisdiction of residence (15%),
- Revenue miles of bus operation in each jurisdiction (35%),
- Revenue hours of bus operation in each jurisdiction (25%).
The recommendation is to convert to the new formula for regional services in FY 1999,
(i.e., beginning July 1, 1998) with annual transition limits applied between FY 1999 and
FY 2002.
The Panel recognized that the ridership allocation factor creates an apparent
disincentive to increase ridership. The Panel recommends that the weighting factor for
ridership be lower than that of other factors, and that a ridership incentive factor
continue to be considered for subsidy allocation purposes.9
Back to Regional Mobility Panel Report
Table of Contents
V.3. WMATA Service And
Financial Commitment
The Panel embraced and committed to WMATA's pledge of constant average regional bus
fares and maintaining bus subsidy levels through aggressive cost controls. This commitment
is for the five year period FY 1998-2002, and includes a pledge for advancing service
improvement strategies in unserved and under served portions of the region. It is further
detailed below:
Metrobus Subsidies:
- No increase in subsidies for regional service or for WMATA-provided non-regional bus
service through FY 2002
- WMATA will strive to provide non-regional services at rates that are competitive with
the local market
- Constraints on subsidies are exclusive of any unfunded federal mandates, reductions in
federal operating assistance or mitigating emergency circumstances
Metrobus Passenger Fares:
- No increase in the average passenger fare through FY 2002
- Local jurisdictions can maintain fare incentives through buy-down program
- Propose and implement fare simplification and integration to introduce a consistent fare
policy on bus service in the region
Regional Customer Service
- Maintain baseline level of regional bus service with appropriate changes related to
Metrorail openings
- Develop a comprehensive and integrated regional customer service and marketing program
- Plan new service initiatives targeted toward meeting the current and future
transportation needs of under served and unserved markets, subject to the availability of
funding
Regional Bus Service Planning:
WMATA and local governments jointly establish a coordinated service planning process
that embraces:
- Service quality standards (such as: service reliability, cleanliness, convenience, etc.)
for regional and non-regional bus services
- Coordination of regional and non-regional route service modifications
- Consistent with these standards, a cooperative, consultative and coordinated planning
process will be established among WMATA, the local jurisdictions, and local bus service
operators. WMATA plans and operates the regional bus system through a consultative process
with local jurisdictions, where decisions are based on need and cost. Local jurisdictions
plan non-regional services that are coordinated with regional services to the extent
practical.
Back to Regional Mobility Panel
Report Table of Contents
V.4. Five Year Transition Plan
The Regional Mobility Panel recommends implementation through a five
year transition plan with progress reviews scheduled in years three and five. The details
of this plan are presented in the table on pages 30 and 31.
Back to Regional Mobility Panel Report
Table of Contents
V.5. Regional Financial
Agreement
The Regional Mobility Panel recommends that local jurisdictions and
WMATA enter into an interjurisdictional financial agreement including a long-term
financial commitment to participate in the regional bus system in accordance with the
regional service plan, new subsidy allocation formula and five-year transition plan. The
principles of the interjurisdictional financial agreement for funding and maintaining the
regional bus system are presented below.
The parties agree to an interjurisdictional financial agreement to
participate in the regional Metrobus system. The initial term of the commitment is for
five years. They further agree to review the structure and extent of the regional bus
system every two years to determine its adequacy as part of the five year continuing
commitment term. Any adjustments to the regional bus system will be approved by the WMATA
Board, subject to funding limits in agreements with local jurisdictions.
Subject to appropriation, local jurisdictions commit to funding the
costs of operating the regional bus service at specified levels.
By May l of each year, local jurisdictions notify WMATA of the
commitment to fund the operating subsidy for regional bus services for the following year.
WMATA commits to the continuing operation of regional bus service at
or above the established levels for regional services for the period FY 1998 through
FY 2002. Thereafter, regional bus service levels are determined by standards established
and approved funding levels. All parties agree to maximize efforts designated to increase
ridership.
WMATA commits to maintaining average bus fares at or below the levels
presently in effect for the period FY 1998 through FY 2002.
This agreement is subject to participation by all WMATA member
jurisdictions.
WMATA's ability to fulfill its commitments is subject to continuation
of Federal operating assistance, no new Federal mandates affecting costs or service, and
mitigating emergency circumstances
This Agreement commits the region to pursue, support and implement
necessary action in the District of Columbia, Maryland, Virginia and the U.S. Congress
during the five-year transition period to fully fund the annual needs of the WMATA Capital
Improvement Program, as determined by the Regional Mobility Panel.
5. City of Fairfax CUE service and Prince
George's County Bus service were also operated during this period; they accounted for
smaller mileage figures and do not appear in the exhibit.
6. A more detailed presentation of the trends in local jurisdiction bus
service is presented in section 2.4.1 of the Technical Appendix.
7. Data comparing metropolitan and suburban operator cost rates
are presented in the Technical Appendix.
8 A list of regional activity centers is included in the
Technical Appendices.
9. Examples of mechanisms for a ridership incentive are presented
in the Technical Appendix.
Back to Regional Mobility Plan Table of
Contents
Forward to Transition Plan Table |
