
Back to Mayor’s main page — Press release on FY2000 budget — Press briefing on FY 2000 budget — Testimony on FY 2000 budget
|
Columns DCWatch
Archives Elections Government and People Budget issues Organizations |
Completing Our Recovery: Financial PlanFinancial Plan Overview The four-year financial plan is a critical tool for ensuring the long-term fiscal health of the District. In the FY 1999 budget, District leaders set out three key goals relevant to this plan — all of which have been met or will most likely be met at the end of FY 1999.
These results show that the District has taken great strides toward improving its financial health. Much work remains to be done, however. Specifically, the District must continue to show progress related to these goals for several reasons:
The FY 2000 Budget and Financial Plan must effectively balance the tradeoffs inherent in serving these interests. In the following discussion, the following will be presented:
These issues will be discussed in turn, beginning with an overview. Financial Plan OverviewThe financial plan reflects the general fund resources necessary to fulfill the Mayor's policy agenda. The purpose of this section is to present the financial plan, describe each item within, and highlight key budget issues. Specifically, the FY 2000 Budget and Financial Plan includes the following initiatives: Supporting our children
Improving government services
Rebuilding the human service network
Expanding the economy
This discussion now turns to an overview of the financial plan, which is presented on the following page. District of Columbia
|
|||||||||||||||||||||||||||||||||||||||||||||||||||||||||||||||||||||||||||||||||||||||||||||||||||||||||||||||||||||||||||||||||||||||||||||||||||||||||||||||||||||||||||||||||||||||||||||||||||||||||||||||||||||||||||||||||||||||||||||||||||||||||||||||||||||||||||||||||||||||||||||||||||||||||||||||||||||||||||||||||||||||||||||||||||||||||||||||||||||||||||||||||||||||||||||||||||||||||||||||||||||||||||||||||||||||||||||||||||||||||||||||||||||||||||||||||||||||||||||||||||||||||||||||||||||||||||||||
| Revenues | FY 1998 Actuals | FY 1999 Budget (Revised Revenue) | FY 2000 Budget | FY 2001 Projected | FY 2002 Projected | FY 2003 Projected |
| 1. Taxes | 2,773,561 | 2,773,800 | 2,847,300 | 2,918,100 | 3,006,000 | 3,110,600 |
| 2. Non-Tax Revenues | 235,188 | 222,746 | 232,741 | 224,751 | 228,133 | 227,146 |
| 3. Federal Payment (Contribution | 198,000 | - | - | - | - | - |
| 4. Lottery | 81,300 | 69,000 | 69,000 | 69,000 | 69,000 | 69,000 |
| 5. Subtotal, Tax Initiatives | 3,288,049 | 3,065,546 | 3,149,041 | 3,211,851 | 3,303,133 | 3,406,746 |
| 6. I.R.C. 414(h) Pick Up | - | - | (1,200) | (1,200) | (1,300) | (1,300) |
| 7. Tax Restructuring | - | - | (66,700) | (81,700) | (82,500) | (83,300) |
| 8. Subtotal, Tax Initiatives | - | - | (67,900) | (82,900) | (83,800) | (84,600) |
| 9. Grants | 1,011,510 | 1,217,043 | 1,270,989 | 1,328,244 | 1,388,847 | 1,451,463 |
| 10. Federal Payments | - | 123,762 | - | - | - | - |
| 11. Private/Other Revenues | 116,954 | 314,660 | 319,291 | 329,830 | 340,933 | 352,006 |
| 12. Subtotal, Non-Local Funds | 1,128,464 | 1,655,465 | 1,590,280 | 1,658,075 | 1,729,780 | 1,803,469 |
| Expenditures (by Appropriation Title) | ||||||
| 14. Government Direction and Support | 153,828 | 164,144 | 196,144 | 203,109 | 210,399 | 217,802 |
| 15. Economic Development and Regulation | 110,581 | 159,039 | 192,767 | 199,164 | 205,877 | 212,618 |
| 16. Public Safety and Justice | 564,269 | 755,786 | 784,581 | 813,101 | 843,711 | 874,968 |
| 17. Public Education System | 734,569 | 788,956 | 858,915 | 879,217 | 905,394 | 932,800 |
| 18. Human Support Services | 1,665,119 | 1,514,751 | 1,594,933 | 1,669,193 | 1,747,783 | 1,829,308 |
| 19. Public Works | 249,142 | 266,912 | 273,480 | 283,428 | 293,804 | 304,447 |
| 20. Financing and Other | 421,136 | 461,622 | 399,210 | 408,542 | 422,329 | 429,632 |
| 21. Receiverships | - | 318,979 | 341,059 | 352,516 | 364,546 | 376,630 |
| 22. Financial Authority | 3,220 | 7,840 | 3,640 | 2,806 | ||
| 23. Local fund support for Enterprise funds | 2,498 | |||||
| 24. Net costs of new insurance coverage | - | - | - | 13,600 | 23,700 | 26,800 |
| 25. Productivity Savings | - | (10,000) | (20,000) | (30,000) | (40,000) | (40,000) |
| 26. Managed Competition Savings | 0 | 0 | (31,900) | (55,900) | (76,700) | (104,700) |
| 27. General Supply Schedule Savings | - | - | (20,000) | (20,560) | (21,156) | (21,727) |
| 28. Productivity Bank | 30,000 | |||||
| 29. Tobacco Settlement Funds for Debt Service | - | - | 16,050 | 12,610 | 15,142 | 15,285 |
| 30. Workfare Investment | - | - | 17,800 | 25,000 | 12,000 | 12,000 |
| 31. Federal Payments to be allocated | - | 100,700 | - | - | - | - |
| 32. Total Expenditures | 3,901,864 | 4,521,227 | 4,636,679 | 4,755,826 | 4,906,828 | 5,065,861 |
| 33. Total Surplus – Budget Basis | 514,649 | 199,784 | 34,743 | 31,200 | 42,286 | 59,753 |
| 34. GAAP Adjustments | (69,800) | |||||
| 35. Total Surplus GAAP Basis | 444,849 | |||||
| 36. Fund Balance, Beginning of Year | (332,357) | 112,492 | 312,276 | 347,019 | 378,218 | 420,504 |
| 37. Fund Balance, End of Year | 112,492 | 312,276 | 347,019 | 378,218 | 420,504 | 480,258 |
| 38. Federal Contribution for Mental Health | 117,300 | 9,000 | 9,000 | 9,000 | ||
| 39. Federal Contribution for School Construction | 73,097 | 141,658 | 102,942 | 100,597 | ||
| 40. Federal Contribution for Special Education | 30,000 | 30,000 | 30,000 | 30,000 |
Each item in this plan is described below. The row numbers and headings presented below correspond to those in the financial plan
Having established an overview and description of the financial plan, the next section provides an assessment of this plan's impact on the financial health of the District.
To receive a clean bill of financial health, a financial plan must meet at least three conditions:
The FY 2000 Budget and Financial Plan meets all three of these conditions. With regard to the current year fund balance, this plan includes a budgeted surplus of $34 million for FY 2000. With regard to structural balance, revenues are growing at an average rate of 3.14 percent, whereas expenditures in this plan are growing at 3.00 percent. Positive fund balances are achieved in each year of the financial plan. Figure 1 provides a magnified view of the growth of revenues and expenditures, illustrating that structural balance is sound.
Figure 1
|
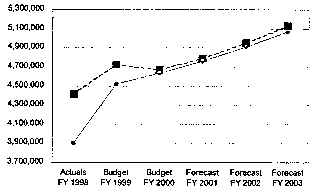 |
Finally, with regard to achieving a positive fund balance, this financial plan not only protects the $312 million projected for the end of FY 1999, it continues building it to $480 million by the end of FY 2003.
In sum, the FY 2000 Budget and Financial Plan effectively balances the need to aggressively invest in critical service delivery while staunchly guarding the financial health of the District. Going forward, these considerations must serve as a constant guide for all current and future spending decisions in the District. The following sections summarize the basis for the revenue and expenditure projections included in the financial plan.
The United States is enjoying the longest peacetime economic expansion in its history and the District of Columbia is sharing in the prosperity. While containing spending has had a positive effect on the elimination of the District's debt, so too has greater than anticipated growth in the revenues of the District. A stronger economy than predicted combined with improved tax administration are among the fundamental reasons for increased optimism for revenue growth in fiscal years 1999 and 2000. The budget improvement experienced by the District parallels comparable improvements all across the country — 46 states had a budget surplus for FY 1997 and the Federal Government actually generated a surplus in FY 1998.
The national forecast is for positive real growth in gross domestic product (GDP) but lower than the average growth for 1997 and 1998. At the beginning of the period, unemployment, inflation and interest rates are all quite low.1
The outlook for the Washington Metro Regional Economy also is favorable, although, in line with national trends, growth may be somewhat lower than in 1997 and 1998. In August 1998, Stephen S. Fuller, a George Mason University economist, observed that in June 1998, the Washington Coincident Index2 stood at its highest level ever. This index represents the current condition of the economy. However, a slight decline in the Leading Index3 in June provided the first sign of a possible slowdown in the area's economy for 1999. DRI anticipates that growth in the Washington Metro Region will change more or less in line with the national economy.
Against the backdrop of a strong national and regional economy, the District of Columbia economy is forecast to show steady growth in FY 1999 and FY 2000. Although at rates below the preceding two years the District is expected to have some small increase in employment and in employment of D.C. residents. Inflation-adjusted gross state product (GSP) and personal income are forecast to increase at average annual rates of 1.1 percent and 1.9 percent respectively. Activities currently underway that will boost the economy include new retail and restaurant development associated with the MCI Center, the transfer of jobs to the Navy Yard, and construction of the new Convention Center.
In looking further ahead to the years 2001 through 2003, the key economic issues are how much the national economy can continue to expand and the extent to which improving public services will stimulate economic development in the District. Nationally, CBO, OMB, and the Blue Chip consensus forecast all anticipate moderate growth from 2001 to 2003. DRI also forecasts growth in the Washington Metropolitan region to continue at about the rate of the nation as whole, although factors such as traffic congestion and the shortage of skilled labor for technology-oriented industries could restrain this growth.
Led increases in the service sector, the District's employment is assumed to increase by about 12,000 positions from FY 2000 to the end of FY 2003. Inflation-adjusted gross state product and personal income are expected to increase at average annual rates of 1.1 percent and 1.7 percent respectively. Resident employment is expected to increase by about 5,000 jobs. Growth in retail sales and a small decrease in population and housing starts are also expected In the hospitality sector of the economy, sales are expected to rise during the 2001 Inauguration and again when the new convention center opens in 2003.
The estimates are conservative, but not gloomy. They anticipate a small real growth in the economy and smaller growth in tax revenue than experienced in FY 1998. Increases in gross state product are expected to be led by the professional services (where tax generation is low) and business services. Resident employment, including self-employment, is forecast to have stabilized in FY 1998 and to show very slight growth in FY 1999 and FY 2000. With the stabilizing of government employment in the District, this is a reasonable hypothesis.
Sales taxes are expected to increase at just under the rate of inflation with no real growth until the new convention center is brought into service. Activity in property sales and deed tax generation are expected to unwind from the highs of FY 1998, but remain higher than in FY 1996. The taxable base of real property tax is anticipated to stabilize in FY 2000, as the activity of 1997 and 1998 begins to be incorporated into tax assessments under the phased implementation of triennial real property assessment. The new administrative appeals system enacted in triennial legislation is settling at the administrative level about 90 percent of the 4,000 cases annually that were referred for adjudication. Because we have no evidence yet of the impact on investment or the number of employed residents due to the 1997 federal Financial Assistance Act, the possible impact on income revenues is omitted from the estimates. The now booming stock market is forecast to advance at moderate trend levels. Neither a financial crash nor a boom is forecast.
The following table sets forth the economic assumptions used in the revenue estimates.
| (Fiscal Years) | 1995 actual | 1996 actual | 1997 actual | 1998 est | 1999 est | 2000 est | 2001 est | 2002 est | 2003 est |
| Gross State Product ($ billion) | 49.23 2.8% |
50.90 3.4% |
52.24 2.6% |
53.66 2.7% |
55.96 4.3% |
58.09 3.8% |
60.53 4.2% |
63.07 4.2% |
65.97 4.6% |
| Real Gross State Product (billions of $92) | 46.59 -0.3% |
47.73 2.4% |
47.89 0.3% |
47.98 0.2% |
48.70 1.5% |
49.06 0.7% |
49.53 1.0% |
50.00 1.0% |
50.70 1.4% |
| Personal Income ($ billion) | 17.74 0.7% |
18.09 2.0% |
18.60 2.8% |
19.09 2.6% |
19.86 4.0% |
20.61 3.8% |
21.48 4.2% |
22.38 4.2% |
23.41 4.6% |
| Real Personal Income (billions of $92) | 16.57 -1.7% |
16.57 0.0% |
16.69 0.7% |
16.97 1.7% |
17.37 2.4% |
17.62 1.4% |
17.91 1.7% |
18.19 1.6% |
18.54 1.9% |
| Per Capita Income ($) | 32,025 3.1% |
33,435 4.4% |
35,058 4.9% |
36,420 3.8% |
38,119 4.7$ |
39,720 4.2% |
41,468 4.4% |
43,251 4.3% |
45,279 4.7% |
| Real Per Capita Income ($92) | 29,910 0.6% |
30,630 2.4% |
31,473 2.8% |
32,375 2.9% |
33,339 3.0% |
33,942 1.8% |
34,577 1.9% |
35,155 1.7% |
35,862 2.0% |
| Population (’000) | 554.0 -2.3% |
541.0 -2.3% |
530.5 -2.0% |
524.5 -1.1% |
521.0 -0.7% |
519.0 -0.4% |
518.0 -0.2% |
517.5 -0.1% |
517.0 -0.1% |
| Households (’000) | 234.0 -1.7% |
228.0 -2.6% |
225.0 -1.5% |
222.0 -1.0% |
222.0 -0.1% |
222.0 -0.1% |
222.0 0.0% |
223.0 0.4% |
224.0 0.3% |
| Civilian Labor Force (’000) | 287.7 -4.7% |
273.8 -4.8% |
259.3 -5.3% |
261.2 0.7% |
262.5 0.5% |
262.6 0.0% |
262.9 0.1% |
263.6 0.3% |
264.3 0.3% |
| At-Place Employment (’000) | 646.2 -2.4% |
627.5 -2.9% |
617.0 -1.7% |
610.9 01.0% |
614.6 0.6% |
617.5 0.5% |
620.0 0.4% |
625.4 0.9% |
630.5 0.8% |
| Resident employment (’000) | 263.0 -5.0% |
250.0 -4.9% |
238.8 -4.5% |
238.9 0.1% |
240.5 0.7% |
242.1 0.7% |
243.7 0.7% |
245.3 0.7% |
246.9 0.6% |
| Unemployment Rate | 8.7% | 8.7% | 7.9% | 8.5% | 8.4% | 7.8% | 7.3% | 6.9% | 6.6% |
| Housing Stock, Total | 267.0 -0.5% |
273.5 -0.9% |
271.1 -0.9% |
269.3 -0.7% |
266.0 -1.2% |
262.9 -1.2% |
260.0 -1.1% |
257.2 -1.1% |
254.3 -1.1% |
| Retail Trade Sales ($ billion) | 3.66 -2.9% |
3.39 -7.4% |
3.50 3.4% |
3.70 5.6% |
3.86 4.2% |
4.02 4.2% |
4.19 4.2% |
4.37 4.2% |
4.57 4.6% |
| Retail Trade Sales ($1992 billion) | 3.52 -4.3% |
3.24 -8.0% |
3.32 2.6% |
3.54 6.6% |
3.67 3.7% |
3.72 1.4% |
3.77 1.4% |
3.82 1.3% |
3.89 1.9% |
| Washington Area Consumer Price Change | +2.2% | +2.8% | +2.1% | +1.2% | +2.2% | +2.8% | +2.8% | +2.9% | 2.7% |
In short, the forecast for FY 2000 assumes that the District economy and tax system will function at moderate rates of improvement, with a small measure of real economic growth and growth in tax revenue below the rate of inflation. So long as economic growth is led by sectors that bear relatively little of the tax burden, this pattern can be expected to continue.
The risks against the estimate are both small and large "Small" risks include deviations from the forecast rate of increase in GSP and Personal Income — a 1 percent error in each would adjust the estimates by approximately $20 million from income and sales taxes. Also, the FY 2000 estimate anticipates a lift of about $24 million from tax administration.
The large risks spring from the possibility of recession or growth much more robust than that forecast. A recession that begins immediately and deepens for some months could reduce FY 2000 revenues by $150 million. However, no recession of any size is forecasted at this time. Alternatively, if the local economy and income grow 2 percent more than forecast and financial markets continue strong growth, revenues could be $9.0 million or more above estimate. Finally, the level of voluntary compliance and the possibility of writing off receivables in, for example, Medicaid accounts, both have significant potential to swing revenues either up or down.
Having discussed the revenue side of the financial plan, this chapter now turns to the a discussion of expenditures.
The expenditure projections were developed using a three-step methodology. First, citywide personnel expenditures are estimated using an inflator of 4.3 percent to reflect expenditure increases attributable to step increases and an estimate of additional out-year labor costs. Second, non-personal services expenditures are estimated using projections of CPI growth for the Washington area provided by DRI-McGraw Hill. Third, analysis has been conducted on expenditures where growth is not directly tied to inflation. The table below summarizes the specific expenditure assumptions.
The personal services growth rate reflects an estimate of 1.8 percent growth attributed to step increases and 2.5 5 percent growth related to potential union salary and wage increases. The rate is based on salary growth in the Surrounding Metropolitan Statistical Area (SMSA) and the Federal government in FY 1998 and 1999. Pursuant to the Comprehensive Merit Personnel Act, compensation is deemed to be competitive if it falls reasonably within the range of compensation prevailing in the SMSA. The District may also examine public and/or private compensation outside the SMSA when conditions in the local labor market require a larger sampling in order to establish a reasonable compensation level. Based on these factors, a 2.5 percent personal service growth rate, per fiscal year, represents a conservative increase in costs associated with future labor contracts.
Non-personal services are projected to grow at the rate of growth of the consumer price index for the District of Columbia as projected by DRI-McGraw Hill. The index accounts for the general inflation of goods and services specific to this region. This rate does not account for savings projected under the District's planned use of a general supply schedule or other cost savings initiatives. Such savings can contribute to the overall productivity savings identified in the financial plan.
Fixed costs include energy, telecommunications and rent. A separate trend analysis was conducted on each of these cost to determine future expenditure growth.
Expenditure Category |
Assumed Growth |
||
| FY 2001 | FY 2002 | FY 2003 | |
| Personal Services | 4.30% | 4.30% | 4.30% |
| Non-Personal Services | 2.80% | 2.90% | 2.70% |
| Energy | 1.30% | 1.20% | 1.20% |
| Telecommunications | 2.70% | 2.60% | 2.60% |
| Rent | 2.20% | 2.10% | 2.10% |
| Medicaid | Analysis of cost drivers indicates growth level of 6.0% | ||
| Public Benefit Corporation subsidy | Constant amount throughout the period. | ||
| WMATA Subsidy | Growth level of 4% based on formula that incorporates key factors such as: the District's Metrobus service levels, the number of Metrorail stations in the District, Debt service costs, and Metrorail Construction Costs. | ||
| Financing | Debt service estimates are calculated based on estimated amounts borrowed and prevailing interest rates. | ||
Energy costs include expenditures for automotive fuel, heating fuel, natural gas, electricity, steam and water. The ten-year trend for these items indicates a consistent upward trend in expenditures, with a downward trend in FY 1995 that, compared to the overall trend, is an outlier. In order to gain a more accurate projection, the FY 1995 data was adjusted to reflect the consistent trend over the course of the ten years. Based on this adjusted trend forecast, energy expenditures are expected to grow at a modest rate of about 1.2- percent over the course of the financial plan.
Telecommunication costs have been steadily rising over last ten years. Expenditures for FY 1997 increased by over 40 percent compared to FY 1996. This dramatic increase is attributable to the purchase and replacement of telephone systems that was counted as a telecommunications expenditure. This one-time expense distorts the trend for telecommunications costs. As a result, the FY 1997 data was adjusted by removing the out-year expenditure in order to attain a more accurate projection. Based on this adjusted trend forecast, telecommunications expenditures are expected to grow at a rate of about 2.6 percent over the course of the financial plan.
Rent expenditures were on an increasing trend from FY 1988 to FY 1992. Since FY 1992 rent expenditures steadily declined until FY 1996. FY 1997 saw an increase of 9 percent in rent costs over FY 1996. The large increase from FY 1996 to FY 1997 was due to the fact that the Certificate of Participation expense for the Judiciary Square building was budgeted as rent beginning in FY 1997, but had formerly been budgeted as debt service. This change in the treatment of the CP distorts the overall ten-year trend. Thus, the FY 1997 and FY 1998 data was adjusted by removing the CP expenditure Based on this adjusted trend forecast, rent expenditures are expected to grow at a rate of 2.1 percent in the out-years.
Medicaid is an entitlement program that provides health care insurance and other services to low- income individuals. Because it is an entitlement program, the District must budget enough funds to cover expected expenditures. Between FY 1999 and FY 2000, baseline spending for Medicaid is expected to increase by approximately 5 percent. Over the remainder of the financial plan, Medicaid is expected to grow by approximately 6 percent. This rate is in line with national Medicaid growth rates and reflects trends in health care inflation
The District costs associated with retirement programs for police/firefighters and teachers changed dramatically in FY 1998 due to the passage of the District of Columbia Retirement Protection Act of 1997. This Act transferred most of the liabilities accrued as of June 30, 1997, as well as approximately $3.5 billion in assets to the Federal government. As a result, the District has been relieved of its responsibility to fund the costs associated with this unfunded liability, which was $4.8 billion as of October 1, 1996.
The District's pension contribution beginning in FY 1998 is calculated based on applying a normal contribution rate to the projected payroll for firefighters/police and teachers. The normal contribution rate is consistent in the out-years, so the most significant variable is the growth in payroll. Conservative payroll growth assumptions were used to reflect potential salary increases based on pending labor agreements.
The Washington Metro Area Transit Authority subsidy is projected to grow at a rate of 4 percent over the course of the financial plan. Higher than inflationary growth is projected as new Metrorail stations continue to open, new labor agreements are negotiated, and the provisions of Federal law are implemented. Laws such as the Americans with Disabilities Act, the Clear Air Act Amendments, and the Intermodal Surface Transportation Efficiency Act will impact the District's subsidy requirement.
Debt service estimates are calculated based on the anticipated short and long-term borrowing needs of the District. The general obligation bond debt service estimates are based on a planned debt restructuring that will yield approximately $50 million in savings in each year of the financial plan. For further information, see the Capital Financing Strategies chapter in the Key Budget Issues book.
As District leaders go forward to present a consensus budget to the Congress, they must be fully cognizant of the impact of spending decisions on the financial plan. Difficult tradeoffs are inherent in bold new policy initiatives. The District must balance the expansion of service delivery against the investment in capital infrastructure, and the growth of these expenditures against the reduction of the District's high tax burdens. The financial plan presented above accounts for each of these interests and ensures that critical priorities are served in a manner that protects the newly regained financial health of the District.
1. The Congressional Budget Office (CBO), the Office of
Management and Budget (OMB) and the consensus Blue Chip forecast.
2. The Washington Coincident Index is derived from changes in wage and
salary employment, consumer confidence, nondurable goods retail sales, and passenger
boarding at National Airport.
3. The Washington Leading Index is derived from durable goods sales,
residential building permits, consumer expectations, initial unemployment claims in the
District of Columbia, and the help-wanted index. See Stephen S. Fuller, Economic Forecast,
February 6, 1998, washingtonpost.com.
![]()
Send mail with questions or comments to webmaster@dcwatch.com
Web site copyright ©DCWatch (ISSN 1546-4296)